Published: July 2025
The Local Gov Procurement Index of
Cambridge City Council

All the data in the Local Procurement Index is powered by Tussell’s market intelligence platform
National spending ranks
Out of 311 councils Cambridge City Council was ranked:
£123.5m
spent directly on procurement in 2024
£69.5m spent
with SMEs, representing
56% of total spent in 2024
£2.3m spent
with VCSEs, representing
2% of total spent in 2024
£67m spent
with Local businesses, representing
54% of total spent in 2024
Spending breakdown, mapped

Methodology
This graph shows how your local authority performs on two key measures from the Index:
X-axis: The share of your council’s direct procurement spend that went to local suppliers - defined as suppliers based within your authority’s region.
Y-axis: The share of your direct procurement spend that created social value - defined as spend with SMEs (Small and Medium-sized Enterprises) or VCSEs (Voluntary, Community and Social Enterprises).
Only councils that published a full set of procurement spending data for 2024 are included in the chart.
This analysis highlights which local authorities are leading the way in embedding both local and social priorities into their procurement, and which have room to grow.
Want to benchmark your social value spending against other local councils?
Find out moreRegional ranking
Here’s how Cambridge City Council compares with 44 other authorities in the East Of England.
Only councils with fully published 2024 procurement spend data are included.
Businesses in region
In the East Of England the public sector is working with
18,388 SMEs
2,187 VCSEs
9,871 Local Businesses
Find out who they are
Book a chat with the Tussell team to discover local, SME and VCSE suppliers with a track record of working with local authorities in your area.
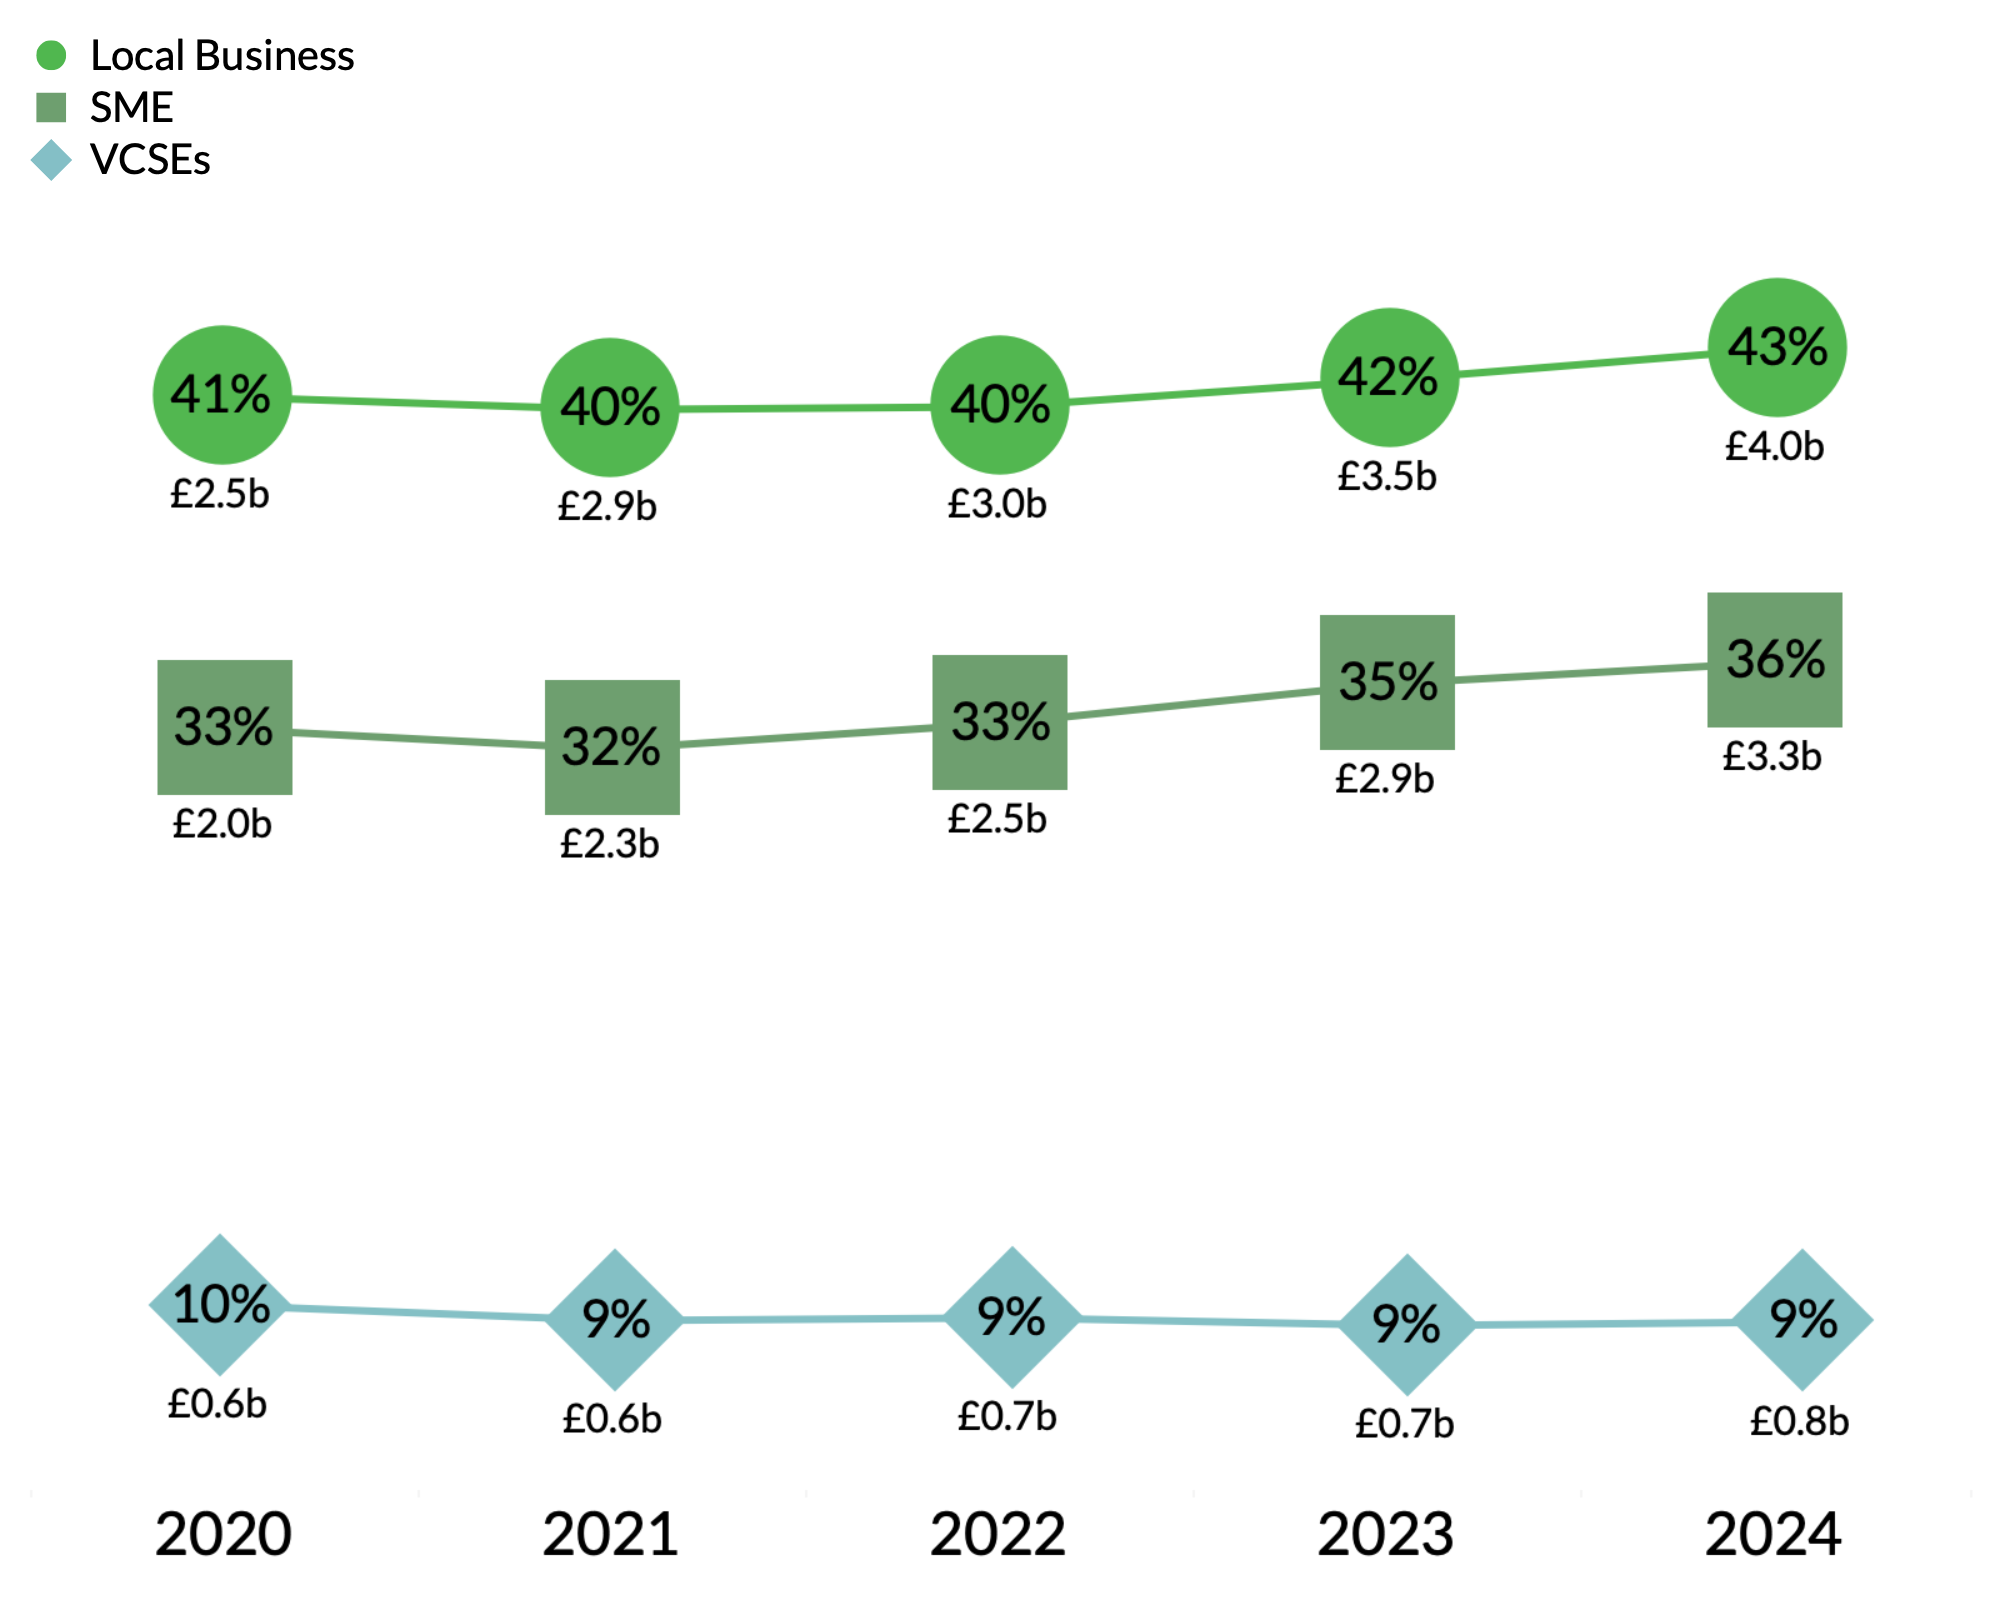
Access our dataEast Of England spending breakdown, by supplier type over time

Methodology
This chart tracks local authorities based in East Of England, their absolute value and the proportion of their procurement spent directly with SMEs, Local Businesses, and VCSEs from 2020 to 2024. Only authorities with complete procurement spend publishing for 2024 have been analysed.
This analysis matters because it reveals how effectively the region is directing spend towards suppliers that generate local and social value, helping benchmark performance, track progress over time and compare your local authority vs the region.
Does Cambridge City Council fall below these benchmarks?
Book in a call with the Tussell team to get actionable insights and improve your performance
Access our dataAll the data in the Local Procurement Index is powered by Tussell’s market intelligence platform
Book a demo
Get a guided tour around the platform, and see how Tussell can help your team make smarter procurement decisions.
Tussell: make smarter procurement decisions
Tussell's all-in-one market intelligence platform is helping Local, Central and NHS procurement teams to:
- Save money and deliver value.
- Understand their categories inside-out.
- Anticipate risk, and identify exposure.
- Promote SMEs and social value.
- Benchmark their team's performance against other authorities.
- Negotiate with suppliers from a position of strength.
- Dig into the hot topics of the day.


.png?width=280&height=90&name=Lincolnshire%20County%20Council%20(1).png)


